MPG - Pipeline Sklearn
1. 1. Eliminer les lignes contenant des lignes manquantes
2. 4. Extraire le constructeur automobile de la variable name et mettre le résultat dans une variable
3. 3. Séparer le jeu de données en X/y (y est la variable mpg et X tout le reste)
4. 4. Séparer le jeu de données en trainset et testset
5. 5. Encoder les catégories de la maniere la plus pertinente
6. 6. Utiliser un Polynomial Feature de degré 2 sur les variables Acceleration, Horsepower et weight
7. 7. Normaliser les variables cylinders, model_year, usa, et constructeur avec MinMaxScaler, et les autres variables avec un StandardScaler
8. 8. Utiliser un selectKBest avec k=10 sur l'ensemble de vos variables
9. 9. Dessiner un diagramme de votre pipeline
10. 10. Mettre le tout dans une pipeline
1. 1. Eliminer les lignes contenant des lignes manquantes
Analyse du Dataset
df = sns.load_dataset('mpg')
df
      mpg  cylinders  ...                       name       brand
0    18.0          8  ...  chevrolet chevelle malibu   chevrolet
1    15.0          8  ...          buick skylark 320       buick
2    18.0          8  ...         plymouth satellite    plymouth
3    16.0          8  ...              amc rebel sst       other
4    17.0          8  ...                ford torino        ford
..    ...        ...  ...                        ...         ...
393  27.0          4  ...            ford mustang gl        ford
394  44.0          4  ...                  vw pickup  volkswagen
395  32.0          4  ...              dodge rampage       dodge
396  28.0          4  ...                ford ranger        ford
397  31.0          4  ...                 chevy s-10       other

[392 rows x 10 columns]
Nombre de NaN par ligne
df.isna().sum()
mpg             0
cylinders       0
displacement    0
horsepower      6
weight          0
acceleration    0
model_year      0
origin          0
name            0
dtype: int64
Données sans Nan
df.dropna(axis=0, inplace=True)
      mpg  cylinders  ...                       name       brand
0    18.0          8  ...  chevrolet chevelle malibu   chevrolet
1    15.0          8  ...          buick skylark 320       buick
2    18.0          8  ...         plymouth satellite    plymouth
3    16.0          8  ...              amc rebel sst       other
4    17.0          8  ...                ford torino        ford
..    ...        ...  ...                        ...         ...
393  27.0          4  ...            ford mustang gl        ford
394  44.0          4  ...                  vw pickup  volkswagen
395  32.0          4  ...              dodge rampage       dodge
396  28.0          4  ...                ford ranger        ford
397  31.0          4  ...                 chevy s-10       other

[392 rows x 10 columns]
Nombre de NaN par ligne après nettoyage des NaN
df.isna().sum()
mpg             0
cylinders       0
displacement    0
horsepower      0
weight          0
acceleration    0
model_year      0
origin          0
name            0
dtype: int64
2. 4. Extraire le constructeur automobile de la variable name et mettre le résultat dans une variable
Liste des constructeurs
constructors=[]...
['audi', 'brougham', 'buick', 'century', 'chevrolet', 'chrysler', 'civic', 'classic', 'colt', 'corolla', 'corona', 'coupe', 'custom', 'cutlass', 'datsun', 'dodge', 'fairmont', 'fiat', 'ford', 'fury', 'glc', 'gran', 'honda', 'hornet', 'malibu', 'matador', 'mazda', 'mercury', 'oldsmobile', 'opel', 'peugeot', 'pinto', 'plymouth', 'pontiac', 'rabbit', 'torino', 'toyota', 'vega', 'volkswagen', 'volvo']
Dataset avec colonne 'constructor'
def extract_brand(name):
    for constructor in constructors:
        if constructor in name:
            return constructor
    return 'other'

df['brand'] = df['name'].apply(extract_brand)
      mpg  cylinders  ...                       name       brand
0    18.0          8  ...  chevrolet chevelle malibu   chevrolet
1    15.0          8  ...          buick skylark 320       buick
2    18.0          8  ...         plymouth satellite    plymouth
3    16.0          8  ...              amc rebel sst       other
4    17.0          8  ...                ford torino        ford
..    ...        ...  ...                        ...         ...
393  27.0          4  ...            ford mustang gl        ford
394  44.0          4  ...                  vw pickup  volkswagen
395  32.0          4  ...              dodge rampage       dodge
396  28.0          4  ...                ford ranger        ford
397  31.0          4  ...                 chevy s-10       other

[392 rows x 10 columns]
Dataset avec colonne 'constructor', sans la colonne 'name'
df_branded = df.drop(columns='name')
df_branded.head()
    mpg  cylinders  displacement  ...  model_year  origin      brand
0  18.0          8         307.0  ...          70     usa  chevrolet
1  15.0          8         350.0  ...          70     usa      buick
2  18.0          8         318.0  ...          70     usa   plymouth
3  16.0          8         304.0  ...          70     usa      other
4  17.0          8         302.0  ...          70     usa       ford

[5 rows x 9 columns]
3. 3. Séparer le jeu de données en X/y (y est la variable mpg et X tout le reste)
y
X = df_branded.drop(columns='mpg')
y = df['mpg']
0      18.0
1      15.0
2      18.0
3      16.0
4      17.0
       ...
393    27.0
394    44.0
395    32.0
396    28.0
397    31.0
Name: mpg, Length: 392, dtype: float64
4. 4. Séparer le jeu de données en trainset et testset
X_train, X_test, y_train, y_test = train_test_split(X,y, test_size=0.2, random_state=0)
X_train.shape
(313, 8)
y_train.shape
(313,)
X_test.shape
(79, 8)
y_test.shape
(79,)
X_train
     cylinders  displacement  horsepower  ...  model_year  origin       brand
220          4          85.0        70.0  ...          77   japan      datsun
256          6         225.0       100.0  ...          78     usa    plymouth
301          4         105.0        70.0  ...          79     usa    plymouth
193          6         200.0        81.0  ...          76     usa        ford
57           4         113.0        95.0  ...          72   japan      corona
..         ...           ...         ...  ...         ...     ...         ...
325          4          90.0        48.0  ...          80  europe  volkswagen
194          6         232.0        90.0  ...          76     usa      hornet
118          4         116.0        75.0  ...          73  europe        opel
48           6         250.0        88.0  ...          71     usa        ford
174          6         171.0        97.0  ...          75     usa        ford

[313 rows x 8 columns]
5. 5. Encoder les catégories de la maniere la plus pertinente
categorial_col = ['origin']
ordinal_col = ['brand']
discret_col = ['cylinders', 'model_year']
continuous_col = ['displacement','horsepower','weight','acceleration']

categorial = OneHotEncoder(sparse_output=False, drop='first')
ordinal = OrdinalEncoder()
6. 6. Utiliser un Polynomial Feature de degré 2 sur les variables Acceleration, Horsepower et weight
polynomial_col = ['weight','acceleration', 'model_year']
polynomial = PolynomialFeatures(degree=2, include_bias=False, interaction_only=True)

column_transformer = ColumnTransformer(
    [
       ('categorial', categorial, categorial_col),
       ('ordinal', ordinal, ordinal_col),
       ('polynomial', polynomial, polynomial_col)
    ]
    remainder='passthrough',
    verbose_feature_names_out=False
)
ColumnTransformer(remainder='passthrough',
                  transformers=[('categorial',
                                 OneHotEncoder(drop='first',
                                               sparse_output=False),
                                 ['origin']),
                                ('ordinal', OrdinalEncoder(), ['brand']),
                                ('polynomial',
                                 PolynomialFeatures(include_bias=False,
                                                    interaction_only=True),
                                 ['weight', 'acceleration', 'model_year'])],
                  verbose_feature_names_out=False)
Column transformer 1
Test intermédiaire
X_train_tmp1 = X_train.copy()
column_transformer1_out = column_transformer1.fit_transform(X_train_tmp1)
result = column_transformer1_out.iloc[0:2,:]
     origin_japan  origin_usa  brand  ...  cylinders  displacement  horsepower
220           1.0         0.0   12.0  ...          4          85.0        70.0
256           0.0         1.0   29.0  ...          6         225.0       100.0
301           0.0         1.0   29.0  ...          4         105.0        70.0
193           0.0         1.0   16.0  ...          6         200.0        81.0

[4 rows x 12 columns]
7. 7. Normaliser les variables cylinders, model_year, usa, et constructeur avec MinMaxScaler, et les autres variables avec un StandardScaler
Column transformer 2
minmax_col = ['cylinders', 'model_year']
standard_col = ['weight','acceleration','weight acceleration','weight model_year', 'acceleration model_year', 'displacement', 'horsepower']

column_transformer2 = ColumnTransformer(
    [
        ('MinMax', MinMaxScaler(), minmax_col),
        ('Standard', StandardScaler(), standard_col)
    ],
    remainder='passthrough',
    verbose_feature_names_out=False
)
ColumnTransformer(remainder='passthrough',
                  transformers=[('MinMax', MinMaxScaler(),
                                 ['cylinders', 'model_year']),
                                ('Standard', StandardScaler(),
                                 ['weight', 'acceleration',
                                  'weight acceleration', 'weight model_year',
                                  'acceleration model_year', 'displacement',
                                  'horsepower'])],
                  verbose_feature_names_out=False)
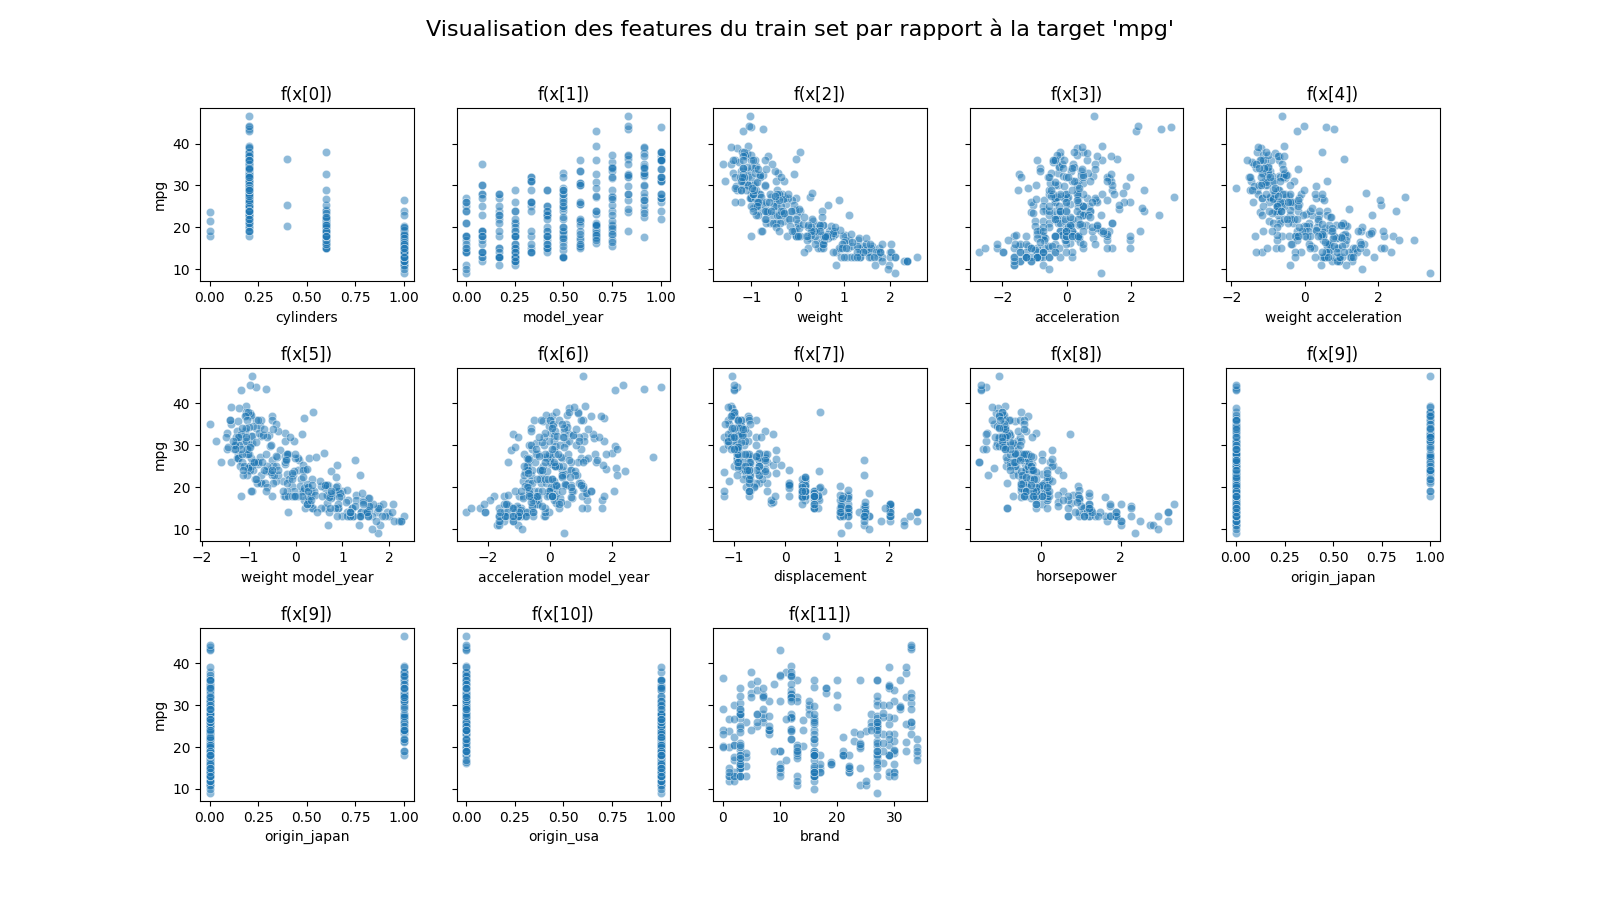
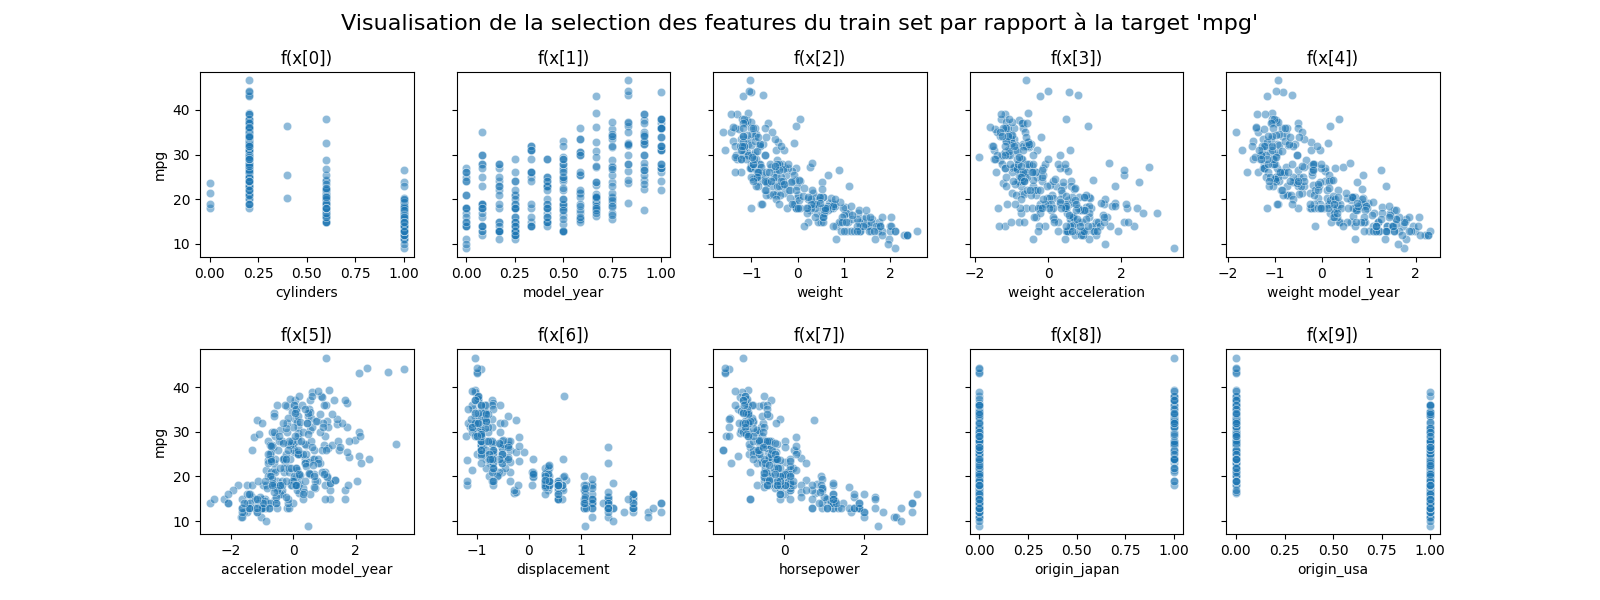
8. 8. Utiliser un selectKBest avec k=10 sur l'ensemble de vos variables
Visualisation des features avant l'application du selectKBest
X_train_tmp2 = X_train.copy()

pipeline_tmp2 = make_pipeline(column_transformer1, column_transformer2)
pipeline_tmp2_out = pipeline_tmp2.fit_transform(X_train_tmp2)
 result = pipeline_tmp2_out.iloc[0:4,:]
     cylinders  model_year    weight  ...  origin_japan  origin_usa  brand
220        0.2    0.583333 -1.223229  ...           1.0         0.0   12.0
256        0.6    0.666667  0.545070  ...           0.0         1.0   29.0
301        0.2    0.750000 -0.919582  ...           0.0         1.0   29.0
193        0.6    0.500000  0.047327  ...           0.0         1.0   16.0

[4 rows x 12 columns]
X_train_visual.columns
X_train_visual = pipeline_tmp2_out
result = X_train_visual.columns
Index(['cylinders', 'model_year', 'weight', 'acceleration',
       'weight acceleration', 'weight model_year', 'acceleration model_year',
       'displacement', 'horsepower', 'origin_japan', 'origin_usa', 'brand'],
      dtype='object')
Integration de SlectKBest dans la pipeline
KbestSelect = SelectKBest(score_func=f_regression, k=10)
pipeline = Pipeline([
   ('Column1',column_transformer1 ),
   ('Column2', column_transformer2),
   ('Feat selection', KbestSelect)
])
     cylinders  model_year    weight  ...  horsepower  origin_japan  origin_usa
220        0.2    0.583333 -1.223229  ...   -0.898424           1.0         0.0
256        0.6    0.666667  0.545070  ...   -0.105920           0.0         1.0
301        0.2    0.750000 -0.919582  ...   -0.898424           0.0         1.0
193        0.6    0.500000  0.047327  ...   -0.607839           0.0         1.0
57         0.2    0.166667 -0.826701  ...   -0.238004           1.0         0.0
..         ...         ...       ...  ...         ...           ...         ...
325        0.2    0.833333 -1.056521  ...   -1.479593           0.0         0.0
194        0.6    0.500000  0.134253  ...   -0.370088           0.0         1.0
118        0.2    0.250000 -0.969594  ...   -0.766340           0.0         0.0
48         0.6    0.083333  0.198555  ...   -0.422922           0.0         1.0
174        0.6    0.416667  0.013985  ...   -0.185171           0.0         1.0

[313 rows x 10 columns]
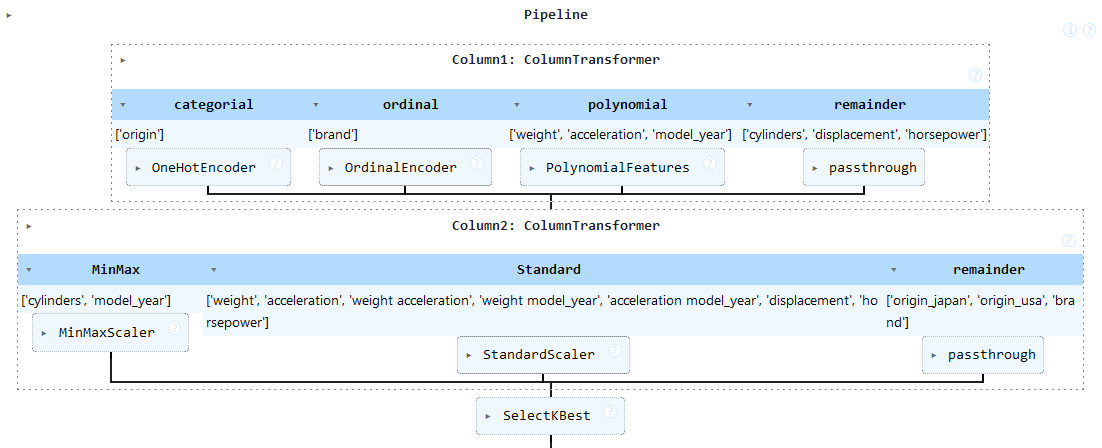
9. 9. Dessiner un diagramme de votre pipeline
pipeline
Pipeline(steps=[('Column1',
                 ColumnTransformer(remainder='passthrough',
                                   transformers=[('categorial',
                                                  OneHotEncoder(drop='first',
                                                                sparse_output=False),
                                                  ['origin']),
                                                 ('ordinal', OrdinalEncoder(),
                                                  ['brand']),
                                                 ('polynomial',
                                                  PolynomialFeatures(include_bias=False,
                                                                     interaction_only=True),
                                                  ['weight', 'acceleration',
                                                   'model_year'])],
                                   verbose_feature_names_out=False)),
                ('Co...
                 ColumnTransformer(remainder='passthrough',
                                   transformers=[('MinMax', MinMaxScaler(),
                                                  ['cylinders', 'model_year']),
                                                 ('Standard', StandardScaler(),
                                                  ['weight', 'acceleration',
                                                   'weight acceleration',
                                                   'weight model_year',
                                                   'acceleration model_year',
                                                   'displacement',
                                                   'horsepower'])],
                                   verbose_feature_names_out=False)),
                ('Feat selection',
                 SelectKBest(score_func=))])